

Over at One Mile At A Time, they did an analysis of the recent IHG Priceless Surprises Promotion where you could mail in 94 entrees and get back 94 plays in an online game. Most entrees only won 500 points but some won 1000, 2000, 5000, and a few won free nights or gift cards. I liked his analysis and it got me thinking about possible wins and the distribution. Instead of doing a bunch of math, it was easier to create a Monte Carlo Simulation and the results were a little surprising.
Monte Carlo simulations are really useful when the outcomes you are trying to calculate are either 1) really difficult to calculate or 2) really annoying to calculate. So, you just set up a simulation that represents the problem. Now if you just run one simulation, your results may be good, or they may be terrible; there’s no way to know. But if you do it a thousand times? Or a million times? Well, you’ll start to get pretty good data that you can trust.
For this simulation I ran through ten million (10,000,000) simulations where a person had 94 plays in this game. I used the probabilities given in the rules to determine wins of group B prizes (Anything above 500) as follows:
Chance of winning 5000 1:42.86
Chance of winning 2000 1:28.57
Chance of winning 1000 1:14.29
Now I did take a couple liberties. First, I ignored all the non points prizes because 1) They didn’t have listed probabilities and 2) them are pretty rare (my guess is less than half a percent) so it shouldn’t make a huge difference. Second, I assumed that you won at least 500 points for every entree received. Some people have gotten “duds”where it said they didn’t win but many of them have latter reported receiving 500 points from that play. In addition to the total number of points won, I also looked at how long it took to win the maximum of five of the group B prizes.
I originally expected the results to look like a traditional bell curve peaking somewhere between 47,000 and 69,500 points (the min and max under the rules).
In reality, there are several numbers that are impossible to hit (like 60,000 or 63,000) and several with extremely low probabilities so instead of a smooth curve, you get several peaks with nothing in between as you can see below. This makes sense when you stop and think about it but wasn’t what I originally expected. There are only 13 different points combinations that have a greater than 1 percent chance of occurring. The average my program computed over 10,000,000 simulations was 54,491 which is extremely close to the most common result of 54,500.
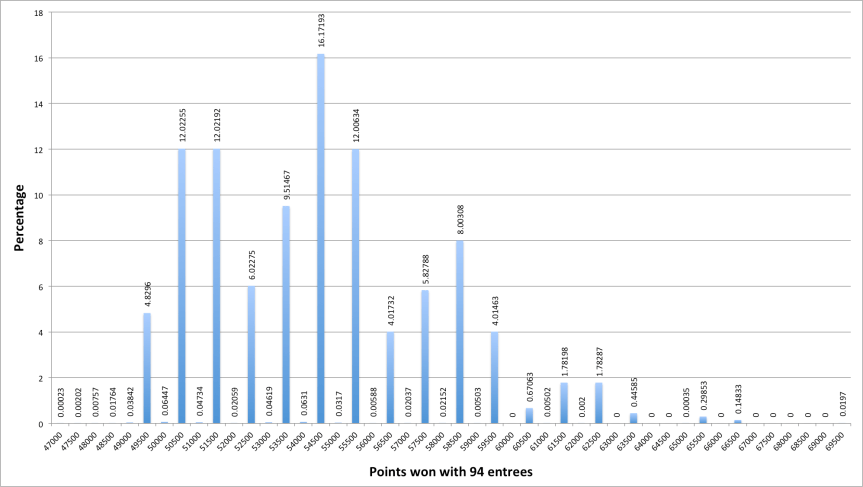
This matched up really well with my family’s results of 49500, 55500, 55500, 57500, and 62,500 (not counting accounts where there were less than 94 plays). In total, we received 574 plays and won 1 free night and 1 $50 gift card. If this is representative, then the chances of winning either of those two are 0.3%, which is why I ignored it in the simulation.
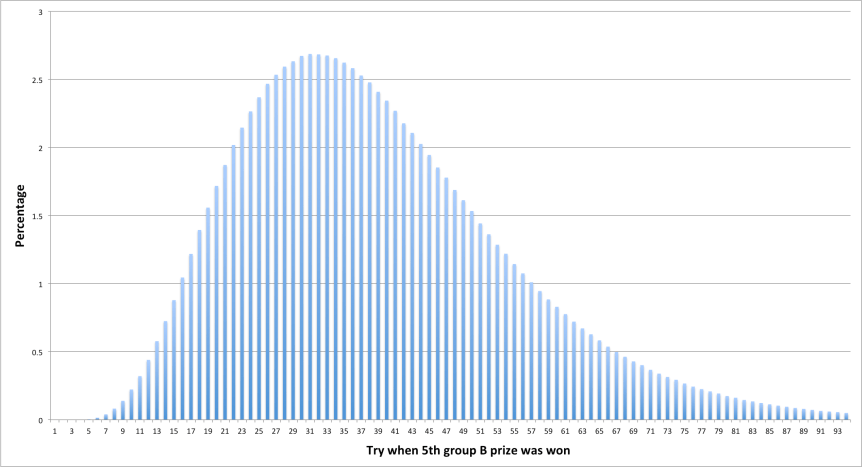
It’s also interesting to look at how long it took to win five group B prizes, which is the max allowed. The average simulation won the fifth group B prize on try 38 and overall, there was a 99.5% chance of winning five group B prizes during the 94 plays. I didn’t keep track of individual plays on mine, but it seems to match up fairly well. There was one account where I hit all five in the first twenty but on another it took until sometime in the sixties.
Below is the C code I used to generate this. I know it’s not the best work but I did it in about twenty minutes on the bus ride to campus so go easy on me.
#include <stdio.h>
#include <stdlib.h>
#include <time.h>

// These are made global variables in order to increase the
//  size because making them in main makes them local in scope
//  so the memory is located on the stack which limits max size
int points[10000000];
int playsFor5B[10000000];

int main()
{
	int loopCount = 0;
	int numLoops = 10000000;
	double totalPoints=0;
	double totalBplays=0;
	double randNum;
	int numBwon=0;
	int numPlayed=0;
	int roundPoints=0;
	int i;
	double chanceOf5000 = 1/0.4286;
	double chanceOf2000 = 1/0.2857;
	double chanceOf1000 = 1/0.1429;

	// Get random number by using time, different every time run
	srand(time(NULL));

	// Loop through exercise numLoops number of times
	for(loopCount=0; loopCount<numLoops; loopCount++)
	{
		// Reset number of b prizes won and number of points won this round
		numBwon=0;
		roundPoints=0;

		// Play game 94 times
		for(numPlayed=0; numPlayed<94; numPlayed++)
		{
			// Generate random number between 0.0000 and 100.0000
			randNum = rand()%1000001 / 10000.0;

			// Find out how many points were earned by testing if
			//  the random number was less than the chances.
			if(randNum < chanceOf5000)
			{
				roundPoints += 5000;
				numBwon++;
			}
			else if(randNum < chanceOf5000 + chanceOf2000)
			{
				roundPoints += 2000;
				numBwon++;
			}
			else if(randNum < chanceOf5000 + chanceOf2000 + chanceOf1000) 			{ 				roundPoints += 1000; 				numBwon++; 			} 			else 			{ 				roundPoints += 500; 			} 			// Make sure we don't have too many round B wins 			// If so, we assume the rest are 500, and exit this loop 			if(numBwon >= 5)
			{
				roundPoints += (93-numPlayed)*500;

				// Records how many plays to get 5 B prizes and exits simulation
				playsFor5B[loopCount] = numPlayed+1;
				totalBplays += numPlayed+1;
				break;
			}
		}

		// Store this rounds winnings in an array and
		//  calculate average so far
		points[loopCount] = roundPoints;
		totalPoints += roundPoints;

	}

	printf("Average won: %d\n", (int)(totalPoints / loopCount));
	printf("Average B: %d\n", (int)(totalBplays/loopCount));

	// Calculate number of times a particular point combination occured
	for(i=47000; i<=69500; i+=500)
	{
		int count=0;
		for(int j=0; j<loopCount; j++)
		{
			if(points[j]==i)
				count++;
		}

		printf("%d, %d\n", i, count);
	}

	// Calculate the number of plays it took to win 5 B prizes
	for(i=1; i<=94; i++)
	{
		int count=0;
		for(int j=0; j<loopCount; j++)
		{
			if(playsFor5B[j]==i)
				count++;
		}

		printf("%d, %d\n", i, count);
	}

	printf("Done\n");
}
